Service graphs

|
|
|

|
Graph Information
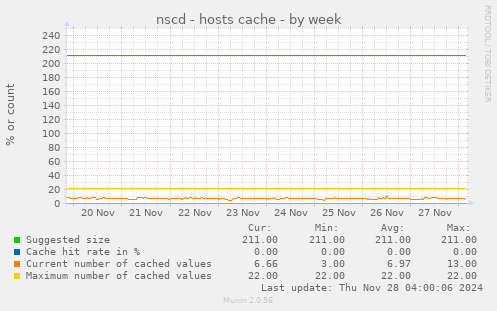
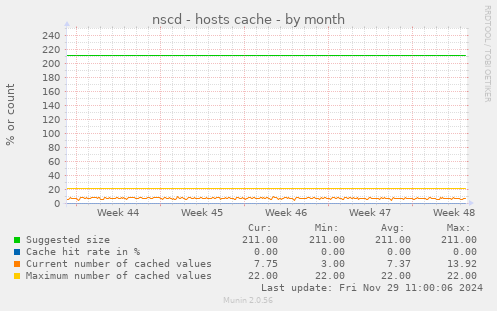
This graph shows nscd hosts statistics
| Field | Internal name | Type | Warn | Crit | Info |
|---|---|---|---|---|---|
| Suggested size | suggestedsize | gauge | |||
| Cache hit rate in % | cachehitrate | gauge | A low cache hit rate in combination with a shared cache configuration is normal, as clients can search the cache directly without asking the nscd daemon first | ||
| Current number of cached values | currnumber | gauge | |||
| Maximum number of cached values | maxnumber | gauge |